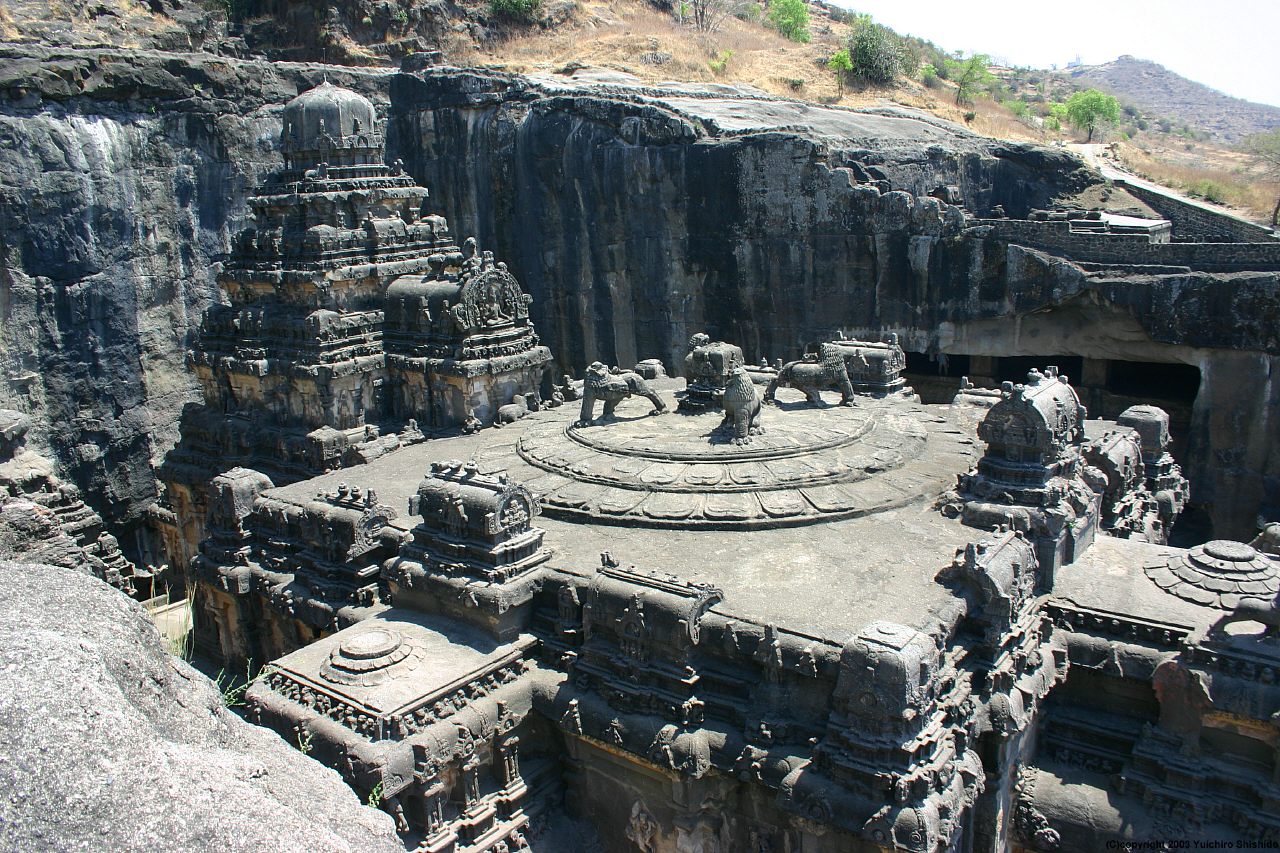
 it wont help you on your architecture course to know this, but hey at least you've now seen another meaning to vernacular construction. :p
Twitter!
14 years ago
From the creator of the facebook group '3D Architecture', this blog page is just to share thoughts and images etc for inspiration as well as a place to discuss project work. Feel free to leave a comment on any of the blogs that I post. Sunny :p
 it wont help you on your architecture course to know this, but hey at least you've now seen another meaning to vernacular construction. :p


 Thats all for now!

